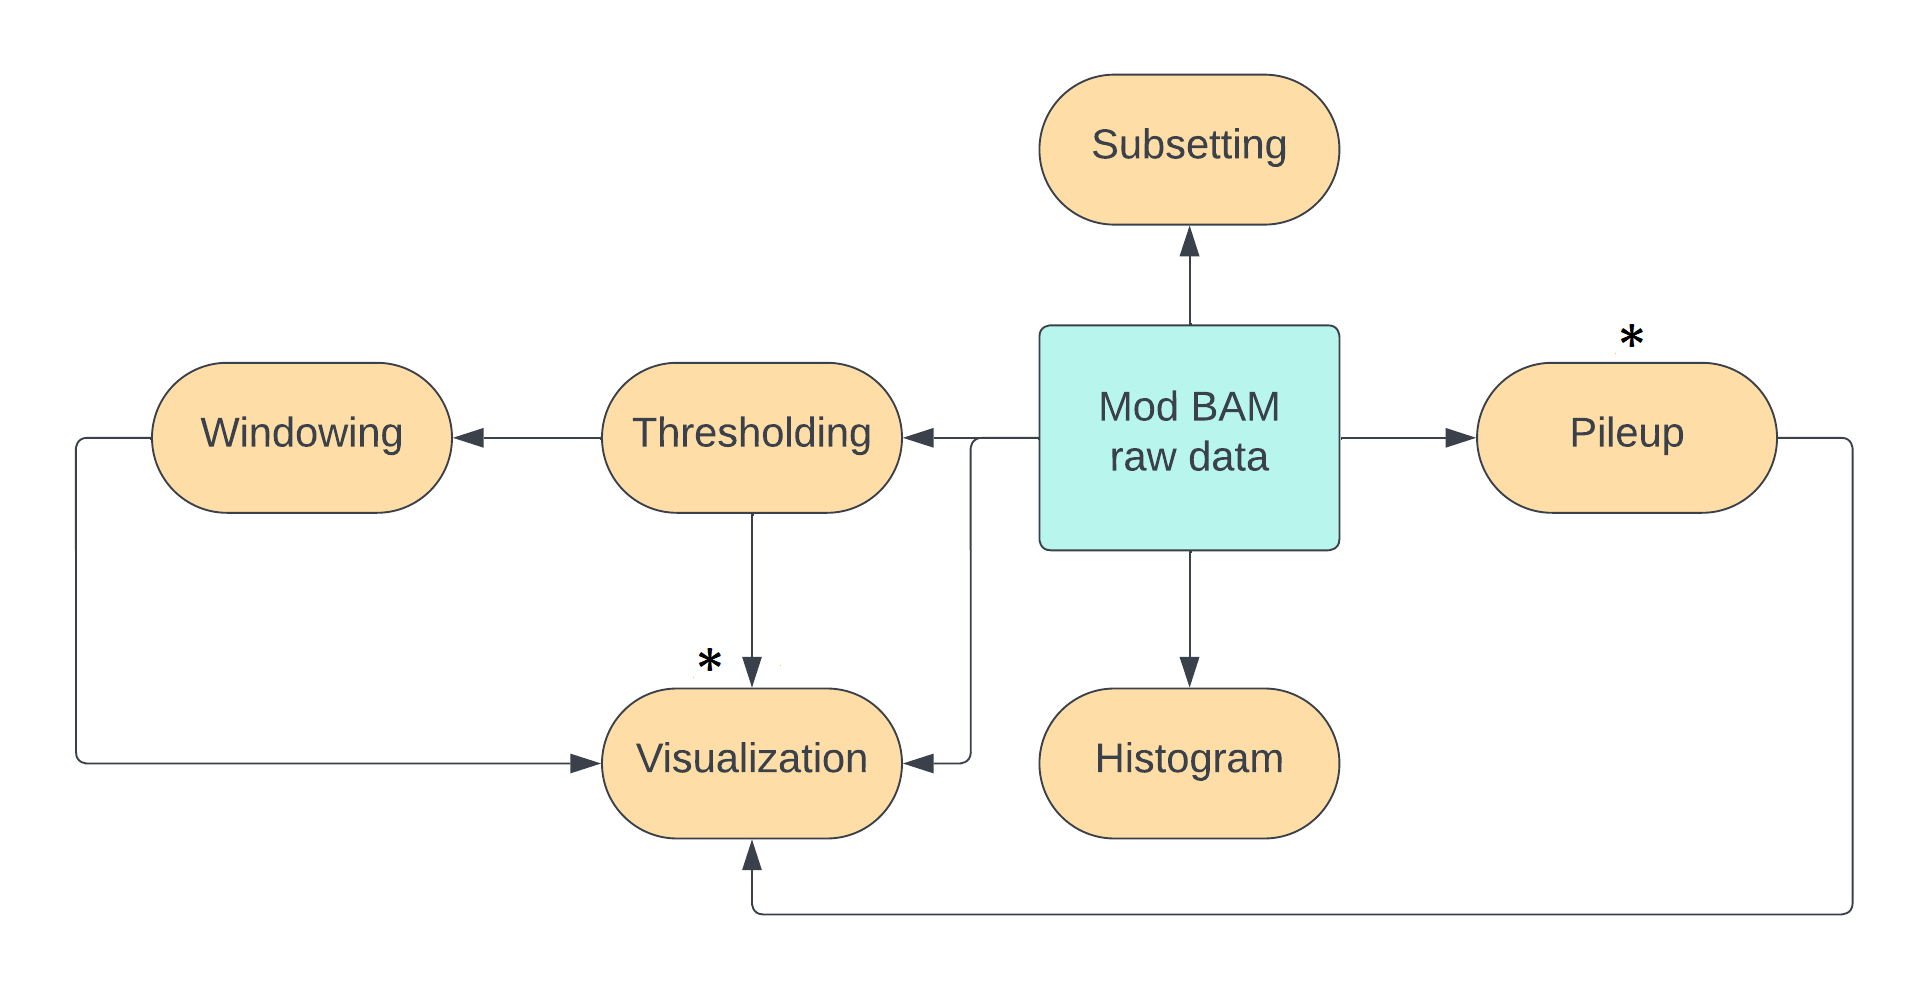
In this session, we will learn to use another visualization package modbamtools,
and learn how to do pileups.
At the end of the lesson, you can do an exercise to explore what you have learnt
in all the hands-on sessions in this course further or you can explore all the mod BAM
files we have generated and the commands you have used on your own.
Visualizing reads and percent modification rates with modbamtools
out_dir=~/nanomod_course_outputs/human/modbamtools
  # set to suitable directory
mkdir -p $out_dir # make directory if it does not exist

modbamtools plot -r chr20:58815000-58895000 \
  --out $out_dir --prefix cliveome --samples cliveome \
  ~/nanomod_course_data/human/bonito_calls.subset.sorted.bam
Open cliveome.html in the output directory.
You should see the screen below.
Please note that you may see different colours than the green and the grey shown here.
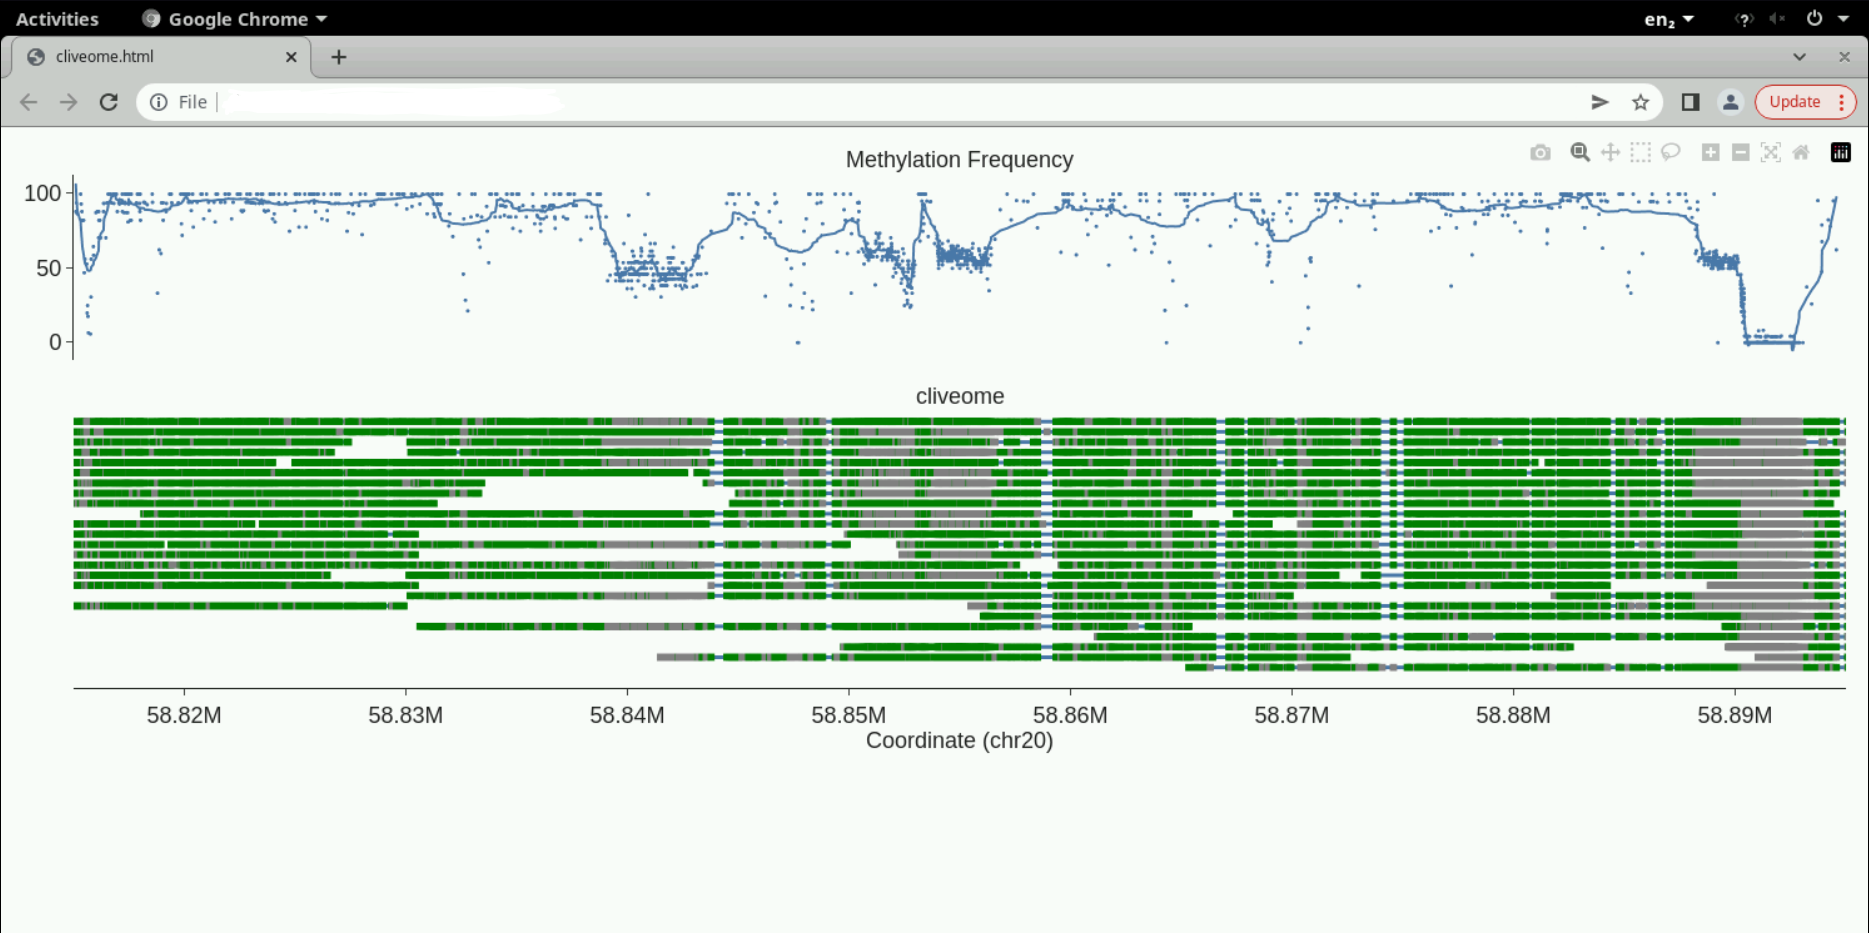
Top track is the percentage of methylation across reads versus coordinate along the reference. The bottom tracks are individual molecules. Move your mouse over them to see the read ids. You can zoom in or zoom out of the plots using your mouse on the top track.
One can optionally produce additional tracks to accompany the plot. These can be annotations like genes or some signal versus the reference coordinate produced by independent measurements. Have a look at the modbamtools tutorial here to explore these options. We have chosen the same genomic location as the example in the tutorial, so we can compare the methylation pattern between the two examples. We have chosen a green-grey colour scheme for our plots here compared with the red-blue of the tutorial.
Calculation of modification statistics with modbamtools
One can calculate modification statistics across several regions with modbamtools.
region_file=~/nanomod_course_outputs/human/modbamtools/regions.bed
# Use a non-existent filename above.
# We will populate this file using the echo commands below.
echo -e "chr20\t58100000\t58200000" > $region_file;
echo -e "chr20\t59100000\t59200000" >> $region_file;

output_bed_file=~/nanomod_course_outputs/human/modbamtools/regions.mod.bed

modbamtools calcMeth --bed $region_file \
    --threads 3 \
    --out $output_bed_file \
    ~/nanomod_course_data/human/bonito_calls.subset.sorted.bam
A few columns are added to the output bed file: average percent modification,
standard deviation of modification, and the coverage.
This calculation offers us an alternate to modkit modbam sample-probs as
the style of the input options is slightly different.
Although the command is called modbamtools calcMeth, it works
on our yeast dataset with BrdU-substituted DNA as well.
Pileup of reference-anchored mod BAM files with modkit
A pileup is any calculation that produces one number per base on a reference
genome by performing an operation across all data available at that base
across all reads passing through that base.
In addition to the percent-modification track produced by modbamtools
above, we have also encountered pileups in the previous
session
on visualization in genome browsers as shown in the figure below.
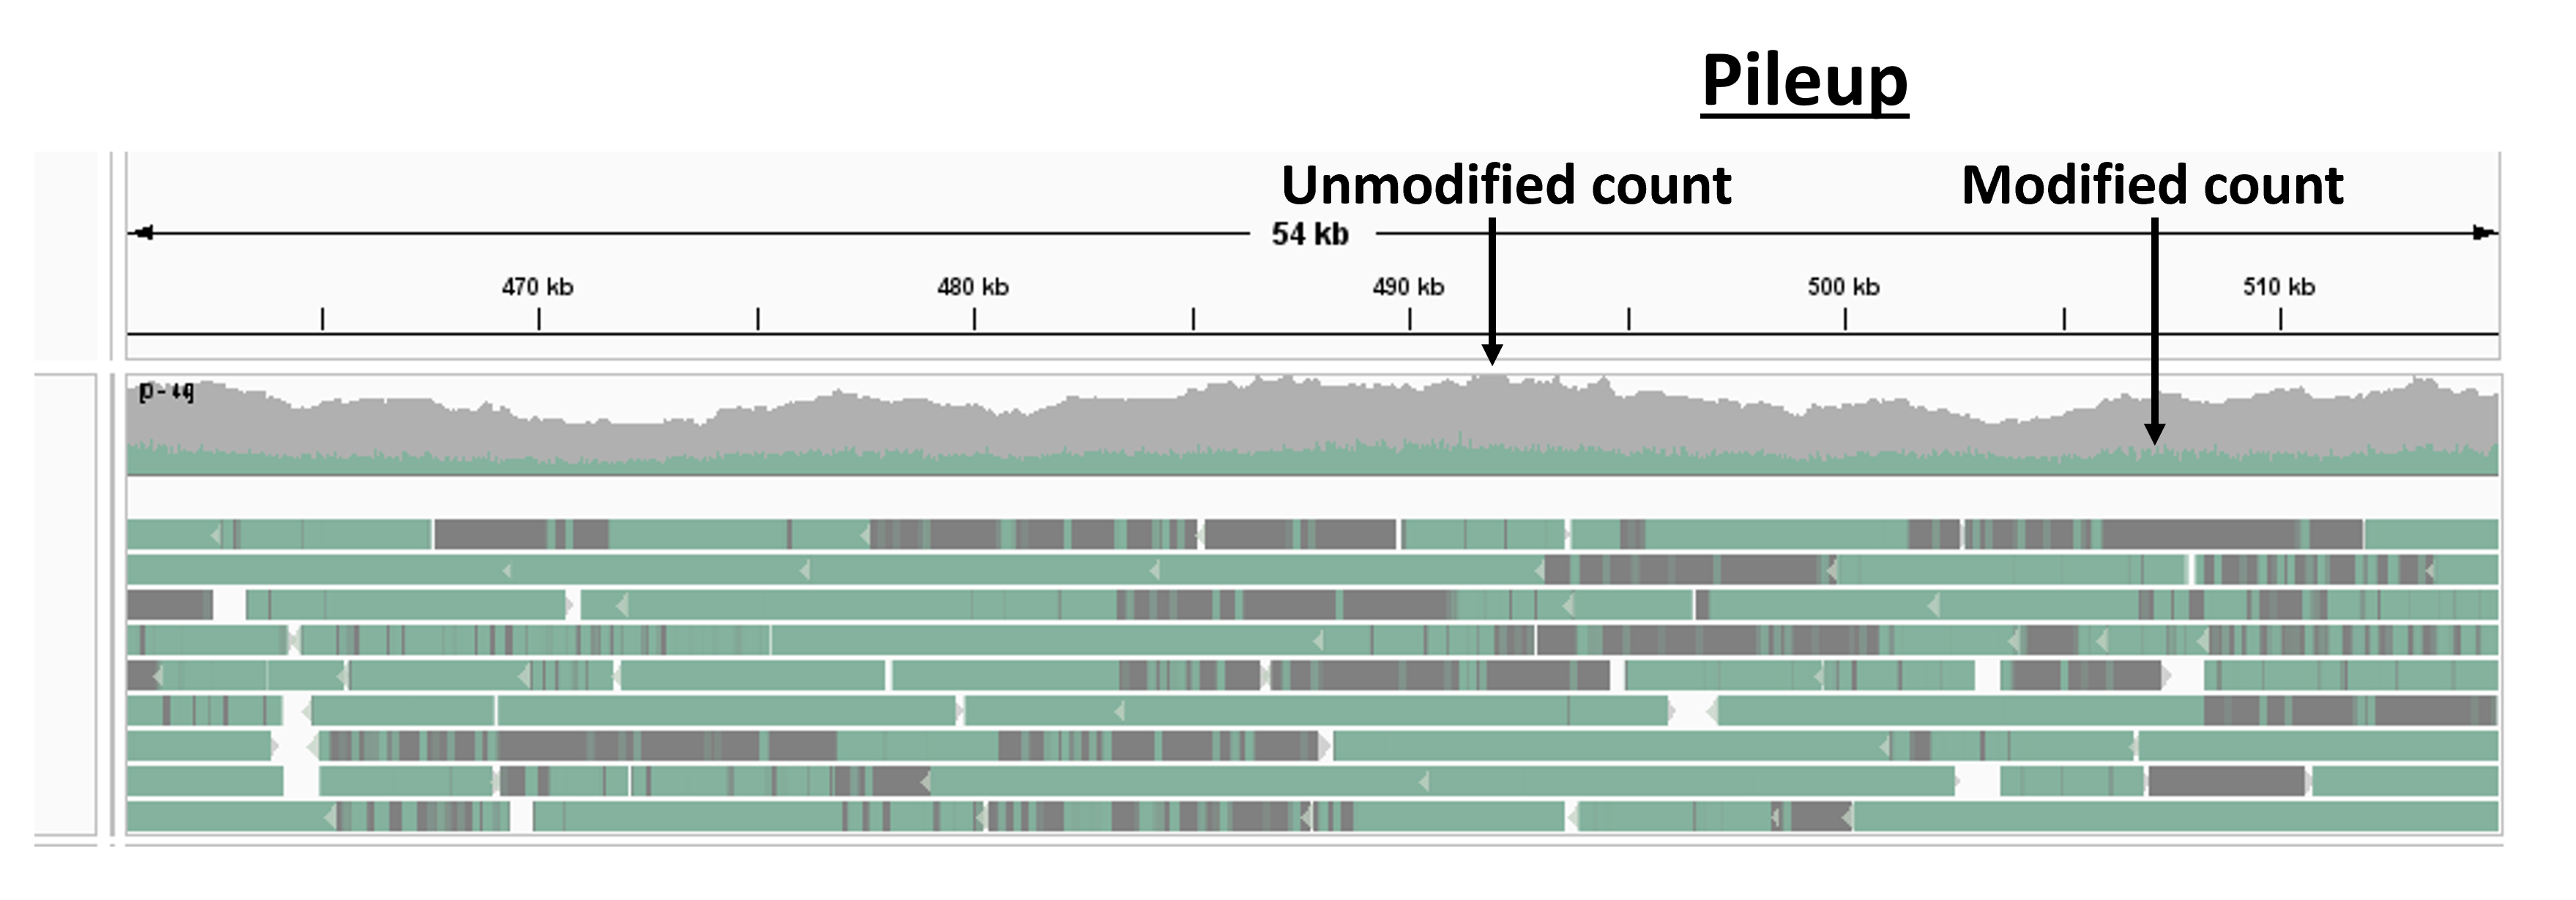
Per base on the reference genome, we can calculate
- the total number of reads
- the total number of modifications
- the fraction of modified reads
input_mod_bam=~/nanomod_course_data/human/bonito_calls.subset.sorted.bam
output_dir=~/nanomod_course_outputs/human/modkit_pileup
mkdir -p $output_dir
modkit pileup --no-filtering --mod-threshold m:0.5\
  $input_mod_bam "$output_dir"/pileup.bed
Now, one can inspect a few lines from the output file
# inspect the first few lines
head -n 20 "$output_dir"/pileup.bed
# inspect a few randomly chosen lines
cat "$output_dir"/pileup.bed | shuf | head -n 20
You can find more details on what the columns mean in the modkit documentation.
Optional: coverage using bedtools
Coverage using bedtools
An alternate way to get the coverage, which is a count of the number of reads passing through each base, one can do
input_mod_bam=         # fill suitably
output_dir=            # fill suitably
mkdir -p "$output_dir" # make output directory if need be
bedtools genomecov -ibam $input_mod_bam -bga >\
  "$output_dir"/coverage.bedgraph
Now, one can inspect a few lines from the output bedgraph
# inspect the first few lines
head -n 20 "$output_dir"/coverage.bedgraph
# inspect a few randomly chosen lines
cat "$output_dir"/coverage.bedgraph | shuf | head -n 20
This method will work even if all the reads in the BAM file do not have any modifications. This is because coverage is just a count of the number of reads passing through each position on the reference.
Optional: modification pileup with samtools
Modification pileup with samtools
One can also perform pileups of modification with samtools.
The command is specified below.
The output format is a little hard to understand and we will discuss its main features.
Please consult the documentation here
if you want to learn more.
input_mod_bam=~/nanomod_course_data/human/bonito_calls.subset.sorted.bam
output_file= # fill suitably
samtools mpileup -M $input_mod_bam \
  -r chr20:58815000-58895000 > $output_file
# we are restricting the pileup above to the specified region
We discuss the columns in the output file using the following three representative lines:
chr20   58815129        N       17      gGGgggGgGgggggGgg       @EJB7E>{9>KGC@9@D
chr20   58815130        N       17      cC[+m255]C[+m255]cccC[+m255]cC[+m2]cccccC[+m255]cc      CCFB7E=F3AGDH=9CD
chr20   58815131        N       17      g[+m255]GGg[+m255]g[+m255]g[+m255]Gg[+m222]Gg[+m255]g[+m255]g[+m255]g[+m255]g[+m255]Gg[+m255]g[+m255]   CAGC=F=D2@J@D:9DD
- The first two columns are the contig and the position on the reference.
- The third column is the base at the reference, given here as the generic N as we have not supplied a reference genome in the input to the command.
- The fourth column is the number of reads passing through the position.
- The fifth column contains a series of bases.
- The number of upper and lower case bases equals the number of forward-mapping and reverse-mapping reads at that position respectively.
- If a read contains a modification, the corresponding base has square brackets appended to it. The modification code and probability from 0-255 appear in the square brackets (Recall from earlier that probabilities are stored as numbers from 0-255 and not as numbers from 0-1 in a mod BAM file).
- The column contains additional information if there are insertions or deletions at this base in the reference. We are not going to discuss this here.
- The sixth column has the base quality encoded as ASCII characters as we have discussed in a previous session on sequence alignment.
This pileup command is useful if you want to do some sophisticated analysis
beyond the measures offered by modkit and modbamtools.
You can pass this as an input to a program written in python or R or any other
text processing tool.